


 St Robert of Newminster Catholic School
and Sixth Form College
United Kingdom
Thinking Maps and School Effectiveness
A Study of a UK Comprehensive School
Teacher Collaboration, Communication and Problem Solving
A change in teacher attitudes towards the use of Thinking Maps® in aiding collaboration, communication and problem solving at St Robert’s is a long term goal. The modelling of maps not only in lessons, but in our planning, communication and coaching should become embedded in our practice. This process is in its infancy, but where it has been implemented has been effective (see Appendix 9):
- NQT lesson observation debriefs (see Appendix 11)
- AST coaching and target setting
- Departmental CPD
- Middle leaders CPD and Review
- Whole-school INSET planning
- Process of change in whole-school policies
- Behaviour management
- T&L Steering Group and SLT Review meetings
At all levels, the school is endeavouring to adopt a more uniform approach to teacher collaboration, communication and problem solving through the use of Thinking Maps®.
VIDEO—Coaching: Lesson Debriefing and Evaluation
Click on the play button above to watch the Coaching: Lesson Debriefing and Evaluation in a Quicktime video. If you don't have quicktime on your Windows or Macintosh, download the free Quicktime Player on the Apple Quicktime site.
Thinking Maps® as a coaching tool for enhancing teacher effectiveness.
Prior to the introduction of Thinking Maps® the de-brief of a Newly Qualified Teacher’s (NQT) classroom practice followed the traditional methodology for feeding back and setting targets for improvement.
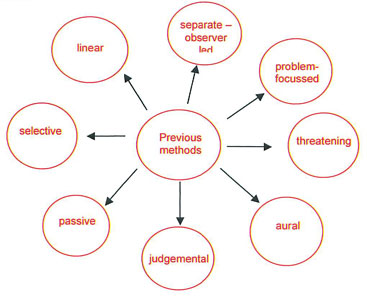
This usually involved the observer reading form his/ her linear notes, attempting to focus in on aspects of the lesson that went well in order to encourage the NQT to continue adopting specific strategies that worked, and identifying elements of planning and delivery that did not work so well in order to generate possible strategies for improving teacher performance.
A significant barrier within this process appeared to be that the NQT does not have access to those notes and as a consequence any teacher de-brief relied on the accuracy of recall being agreed by both observer and the NQT and often a selective account of what had been captured by the observer. Furthermore, it was often difficult for the NQT to remain objective about the lesson during the feedback, often regarding comments intended to improve classroom performance in a negative manner which reduced NQT self esteem.
The bubble map below describes the traditional feedback methods used before our trial.
|
As part of our research into the use of Thinking Maps® for leadership purposes we decided to see what difference their use could make to the objective of increasing NQT effectiveness in the classroom.
Anticipated outcomes
If it was possible to provide a visual map of the lesson, we hoped that the NQT would more easily understand those micro elements of teaching and learning which were required to be tweaked in order to transform teaching and learning in the classroom.
Methodology
A number of Thinking Maps® were deployed, since their introduction in 2008, in an attempt to allow:
- the NQT visual access to the observer’s thinking (and inevitably judgements) about the lesson being observed;
- the observer visual access to NQT feelings and perceptions about the lesson;
- the NQT and the observer to agree the areas for development and strategies to be deployed in order to make teaching and learning more effective.
The lesson de-brief began by inviting the NQT to create a bubble map to describe the lesson she had just delivered (see Appendix 11). This allowed the NQT thinking time for reflection, so she could set the agenda for discussion, and the observer time to focus on how the NQT felt about the lesson and the reasons behind those feelings.
After initial exploration the new map was then “double bubbled”. The NQT compared and contrasted her impressions of the lesson with her bubble map of a previous observation. In this sequence the NQT was given a chance to discuss the planned changes made by her prior to delivering the lesson in order to seek improvement.
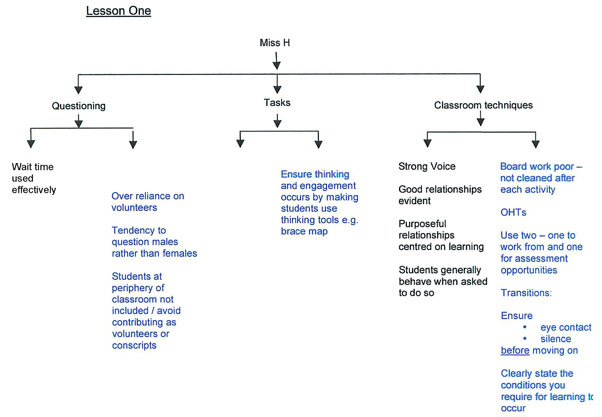
The observer’s flow map was produced which clearly made visible to the NQT the structure of the lesson, key events, planned tasks and transitions between teacher – learner activity.
By allowing the NQT visual access in this way a discussion occurred about whether or not it represented an accurate record of the sequences which occurred in the lesson. Data captured in each sequence could be seen and thus the focus moved more easily into an effective discussion about aspects of planning, teacher behaviour, learner behaviour and outcomes.
The discussion allowed:
- for clarification and negotiation about the validity of statements being made by each party;
- the NQT an opportunity to generate her own ideas about how the lesson could have been improved;
- a valuable discussion about the potential strategies offered to her by the observer which could be deployed in the future;
- a discussion about shifts in planning which may need to occur to enhance the effectiveness of similar lessons in the future.
Offering the NQT access to a visual map of the lesson meant the map itself became the object of the discussion about performance. It allowed the fostering of a relationship based upon mutual respect for each other’s roles. The NQT moved from being merely a recipient of negative feedback (for that is all they seem to hear) towards being an active partner in a co-constructive relationship.
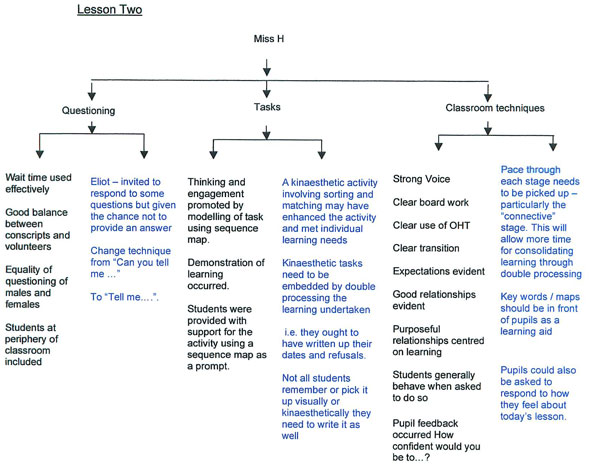
The discussion about teacher performance was summarised by the use of a tree map. Traditionally a lesson debrief would have in it some brief targets (bulleted) for improvement and a number of points that went well. The use of the tree map clearly allowed for the target setting to become more focussed visually on the micro aspects of teaching and learning. This allowed the observer an opportunity to:
- highlight those pedagogical processes which were effectively employed (affirmation and recognition);
- highlight those aspects which needed to be changed for increased effectiveness (informing Continuing Professional Development Needs).
Illustrated below are examples of how tree maps were used with one NQT:
NQT’s Observations (see Appendix 11 - DVD sequence)
The following is a summary of the NQT’s response to the use of Thinking Maps® as a coaching tool.
In the past I would write an evaluation of my lesson which I found hard to do. The feedback was more of an essay. It is a lot easier to view the lesson [use of flow map] if it is presented sequentially. I was surprised how logical it is and it is easier for both of you to see it and discuss it. A bubble map is easier to do as it allows me to focus on five key descriptions and discuss each of these in turn. The [tree] map allowed for clear feedback and it was easier to compare visually how I have improved.
In response to whether there is anything threatening about the use of the maps:
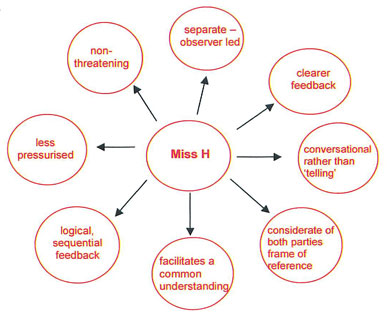
No I was quite comfortable. I didn’t have to think about my writing style. There was a lot less pressure. We could focus on things that make an effective lesson and for me to concentrate on. The maps can also be kept as a form of reference in my file for me to refer back to.
The bubble map below describes the feedback methods following the implementation of Thinking Maps®
The Case Study sections are accessible in the links below and in the upper left column menu on each page of the St Robert Case Study.
- Project Overview
- Teacher Instructional and Higher Order Thinking Levels
- Teacher Methodologies
- Consistency and Frequency of Use
- Teacher Perceptions of Thinking Maps®
- Analysis of Pupils' Perceptions of Themselves as Learners
- Teacher Collaboration, Communication and Problem Solving
- Impact of Thinking Maps®
- Conclusion
- Video Clips
- Download Acrobat PDF copy of St. Robert Case Study