

 St Robert of Newminster Catholic School
and Sixth Form College
United Kingdom
Thinking Maps and School Effectiveness
A Study of a UK Comprehensive School
Consistency and Frequency of Use
Y7 has been targeted for book sampling, in order to assess the frequency and consistency of the use of Thinking Maps®. Initial findings showed sporadic use across all departments in the School; for example English, Science, History, RE, ICT and MFL demonstrated frequent use, whereas other subjects within the Y7 curriculum showed little if any use. This may have been due to the nature of the initial book sampling and in order to assess more accurately, we made the process more robust in our subsequent research.
Consequently, a random sample of 20 students from the cohort was then taken, covering every Y7 teaching group. Every subject in the Y7 curriculum was sampled: French, Geography, Science, Religious Education, English, Maths, History and Art. Results indicated that the subjects where the maps were being used more frequently were French, Science, English and History. The circle and bubble maps were most frequently used maps, whilst the multi-flow and bridge map were least used. Following consultation with staff, it was highlighted that maps are only being used when there is a genuine opportunity in the lesson, where they support and scaffold the learning (see Appendix 2 – DVD: Teaching & Learning Steering Group). Furthermore, staff added that certain Thinking Maps® appear to be subject-specific and fit for purpose. The brace map, for example, seemed to be of more use to pupils in Science and PE, where there are tangible ‘wholes’ which need to be broken down.
We know that the circle map has proved successful in assessing what students know and how they know it. Yet a further outcome has been that the use of the frame of reference has enabled students to identify gaps in their knowledge. This was particularly useful in a Y13 tutorial lesson, when students were recalling their existing knowledge about asylum seekers. The debriefing of the circle map activity revealed that much of the students’ knowledge was inaccurate, because their primary source was the media (see Appendix 3). A fruitful discussion regarding bias and spin followed and the students then explored other sources of information, resulting in a more accurate and rounded knowledge base.
Every student in Y7 completed the questionnaire, which was designed to assess the impact the maps are having on our students’ learning and results were collated (see Appendix 4 & 5).
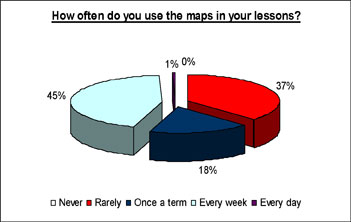
As illustrated, 64% of the cohort use the maps to a degree with 46% using them every week.
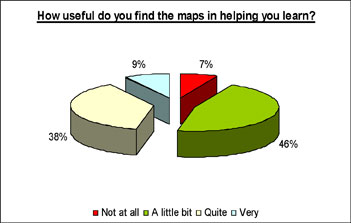
An encouraging statistic is that 93% of students find the maps useful to a degree in helping them learn.
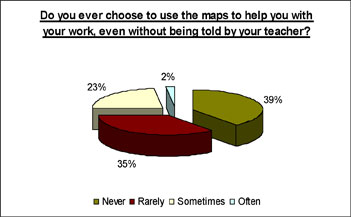
25% of students use the maps spontaneously. This was exemplified during the SLT review of Thinking Maps®, when the Assistant Head Teacher described the planning process of the Fair Trade project, led by Y8 students. Without being prompted, the students opted to use Thinking Maps® to plan and structure the project.
Examples of good practice
In order to share good practice amongst staff and provide evidence of the consistent and frequent use of Thinking Maps®, we have gathered examples of the maps in use (see Appendix 6). These are available to staff via the School intranet and further examples of good practice are discussed regularly at the Teaching & Learning Steering Group.
The Case Study sections are accessible in the links below and in the upper left column menu on each page of the St Robert Case Study.
- Project Overview
- Teacher Instructional and Higher Order Thinking Levels
- Teacher Methodologies
- Consistency and Frequency of Use
- Teacher Perceptions of Thinking Maps®
- Analysis of Pupils' Perceptions of Themselves as Learners
- Teacher Collaboration, Communication and Problem Solving
- Impact of Thinking Maps®
- Conclusion
- Video Clips
- Download Acrobat PDF copy of St. Robert Case Study