

Learning Prep: Thinking Maps
West Newton, Massachusetts
Imagine if one had an innovative strategy that would raise test scores significantly, that would help one think more clearly and concisely, that would enable one to "construct, organize, assess, and convey knowledge" even better than a graphic organizer (Hyerle, 1995, 85). There exists a new visual tool published in 1995 called Thinking Maps that claims to accomplish these goals, although limited research has been conducted on their actual efficacy. Thinking Maps' creator, D. Hyerle, professes that these enhanced visual tools help students learn more effectively and efficiently; lessons reportedly can be taught in less time with increased retention (Hyerle and Curtis, 2001).
Fifteen years ago, Hyerle discovered that students could complete semantic maps such as brainstorm webs and graphic organizers, but they were unsure of what to do with this information once they had written it down, i.e., they were unable to develop it into a well-organized essay (1995, 85). He studied human thought process and established that spatial formats which address every thinking process could be utilized to "generate and organize.. . thoughts and ideas, either on paper or by using.. . software" (Hyerle, 1995, 85). He called these visual tools Thinking Maps and began implementing them as comprehension aids at all educational levels, in kindergarten through the twelfth grade (Hyerle, 1995, 85).
Hyerle writes: "students may exit our schools with the ability to read text, but not build meaning. Our students' cognitive skills development-the foundation of every school's goals or mission statement-are randomly supported, rarely raised to the level of fluency, and nearly absent as a distinct dimension of assessment. .. . And, as we know from our brain research, we must facilitate the patterning of content knowledge as a foundation for learning. Thinking Maps, as a language of visual tools based on fundamental thinking skills, has been proven as one route for unifying content and process instruction, and assessment of products. (2000, 102)
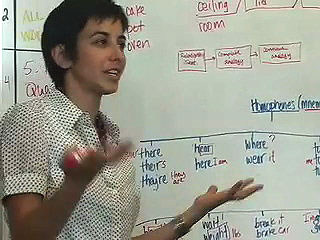
Interview with teacher Gia including sharing effective use of students using a visual language.
![]() Watch the video clip in Quicktime (8:27)
Watch the video clip in Quicktime (8:27)
Hyerle had realized that humans no longer think exclusively in linear patterns. He acknowledges that Thinking Maps help students become independent, motivated learners and enable students and teachers to see what the students are thinking. Flexibility is one benefit to using the maps; they may be adapted in complexity for the student who is using them (Hyerle, 1995, 86-88). Hyerle believes that the principal reason for their success is due to the fact that that they are "a common visual language among students and between students and teachers" (1995, 87-88).
Download the Improving Reading Comprehension Through Visual Tools Thesis by Cynthia Manning
- Thesis Summary (pdf file)
- Complete Thesis (pdf file)