

Assessment
The Assessment Page includes many weblinks and information shared at the recent ASCD presentation:
- Bifocal Assessment: Combining Teaching and Learning with Thinking Maps
Presented by David Hyerle, Ed.D., founder of Thinking Foundation
and Kimberly Williams, Ph.D., Hobart and William Smith Colleges
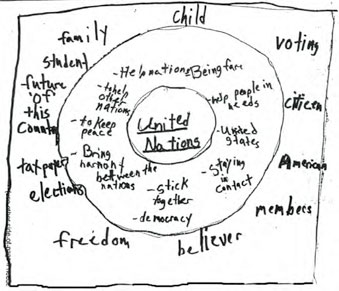
The Assessment using Thinking Maps Circle Map below provides an overview of the presentation. Scroll down below the Assessment using Thinking Maps Circle Map for specific weblinks referenced in the Circle Map.

Bifocal Assessment in the Cognitive Age: Thinking Maps for Assessing Content Learning and Cognitive Processes
by David Hyerle, Ed.D. and Kimberly Williams, Ph.D.
The New Hampshire Journal of Education (Plymouth State University and ASCD), 2009
 In this article the authors first surface the need for reframing formative and summative assessment in this, the cognitive age of the 21st century. The Thinking Maps model is introduced as a theoretical and practical common visual language for teaching, learning and assessment that reflects what we know about how the brain works, learning, and cognition. Thinking Maps--as a language--allows teachers to see student content learning and thinking processes through the same bifocal lens—viewing the content at the surface and cognitive processing more in depth. After this overview and then a discussion of the validity of the model, the investigation turns to look at student work with Thinking Maps as they develop fluency with the tools and the capacity to transfer the tools within and across disciplines. Formative assessment of fluency and transfer are described and then the authors discuss how the maps may also be used within the area of summative assessments, using the MAPPER holistic scale. The authors investigate how our assessment tools need to keep pace with our new understanding about how the brain learns and processes information, offering tools for educators and learners to determine not only “what” is learned but also “how” it is learned.
![]() Read the article: Bifocal Assessment in the Cognitive Age: Thinking Maps for Assessing Content Learning and Cognitive Processes (PDF file)
Read the article: Bifocal Assessment in the Cognitive Age: Thinking Maps for Assessing Content Learning and Cognitive Processes (PDF file)
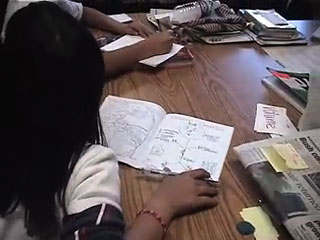
![]() View the student work: Download the the PDF file of Bifocal Assesssment Student Work.
View the student work: Download the the PDF file of Bifocal Assesssment Student Work.
 Visual Tools for Transforming Information Into Knowledge
David Hyerle, Author
Arthur L. Costa, Prologue
Robert J. Marzano, Foreward
Corwin Press, 2008, Second Edition
This is the most comprehensive book on graphic organizers, Thinking Maps®, and graphic software programs. Find out why visual tools and mapping are the key tools for 21st century learning. Look at student and teacher work and review test results from around the country. In a rich and provocative writing style, David Hyerle, Ed.D. draws together examples from teachers, administrators, brain researchers, and parents to make a very exciting read.
A sampling of the book (online and pdf files):
- comprehensive Table of Contents
- Chapter 7: Thinking Maps (p115-144) which includes Tools for Transforming Information into Knowledge (p128-136)
- Chapter 8: Thinking Maps for Special Needs
- Click here to order the book Visual Tools for Transforming Information Into Knowledge by David Hyerle.
Stu dent Successes With Thinking Maps®
David Hyerle, Editor
with Sarah Curtis and Larry Alper coeditors
Corwin Press, 2004, Thousand Oaks, California
This unique professional book is a comprehensive documentation of the theory, practice and research behind Thinking Maps. There are 17 chapters offering research and results, grouped into four sections:
- Thinking, Language and Learning;
- Integrating Content and Process;
- Whole Learning Communities; and,
- Professional Development.
Read the following Chapters (pdf files):
For more on Student Successes With Thinking Maps® go to the following links:
 Roosevelt Elementary School Case Study:
A First Language for Thinking in a Multilingual School
Long Beach, CA
My intent as the instructional leader of Roosevelt School [Stefanie R. Holzman, Ed.D.] was initially isolated on these tools for a direct and immediate impact on student performance. What I didn't realize and could not foresee were the deeper effects upon the development of teachers across our year-round, multitrack school as a result of the use of Thinking Maps in their classrooms. Read about Roosevelt Elementary School including video clips and test data.
![]() Go to the Roosevelt Elementary School Case Study
Go to the Roosevelt Elementary School Case Study
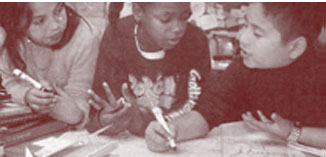
Stefanie Holzman, principal of Roosevelt Elementary School in Long Beach, California, is interviewed in a classroom about differentiation by David Hyerle. Roosevelt Elementary School is an urban, inner city, K–5 school of 1200 minority students (85% of those entering with Spanish as their primary language) that continues to have extraordinary success with teacher and student thinking skills including consistent growth on the state API test scores well beyond the state expectations. The video clip Differentiation in a Multilingual School.
Running Time 2:23
...if you want to assess their content learning... leave it in a map... (from the video clip)
Click on the Play button to play the video.
Not playing or seeing the video clip—download free Quicktime Player (Win & Mac)
![]() Go to the Roosevelt Elementary School Case Study
Go to the Roosevelt Elementary School Case Study
Visual Tools for Constructing Knowledge
David Hyerle, Author
Association for Supervision & Curriculum Development, 1996
Currently Out of Print
“ Deeply rooted in constructivist theory, this book draws on philosophical and psychological models of how the mind works, how human intellectual capacities emerge and grow over time, how humans derive meaning, and how knowledge is structured. The intent is to provide educators with insights into how interventions can be arranged and conditions organized so as to educe, enhance, and refine those human intellectual resources.” From the Prologue by Arthur L. Costa.
- p49-50 webs
- p67-70 graphic organizers
- p89-94 concept mapping
- p112-116 Thinking Maps
- p124-126 conclusions
 Knowledge Cartography: Software Tools and Mapping Techniques (Advanced Information and Knowledge Processing)
by Alexandra Okada (Editor), Simon J. Buckingham Shum (Editor), Tony Sherborne (Editor)
Springer; 1 edition (September 5, 2008)
Knowledge Cartography is the discipline of mapping intellectual landscapes.
The focus of this book is on the process by which manually crafting interactive, hypertextual maps clarifies one’s own understanding, as well as communicating it.
The authors see mapping software as a set of visual tools for reading and writing in a networked age. In an information ocean, the primary challenge is to find meaningful patterns around which we can weave plausible narratives. Maps of concepts, discussions and arguments make the connections between ideas tangible and disputable.
With 17 chapters from the leading researchers and practitioners, the reader will find the current state–of-the-art in the field. Part 1 focuses on educational applications in schools and universities, before Part 2 turns to applications in professional communities.
Read Chapter 4: Thinking Maps®: A Visual Language for Learning by David Hyerle
 Visual Data: Understanding and Applying Visual Data to Research in Education
by Jon E. Pedersen (Editor), Kevin D. Finson (Editor)
Sense Publishers (January 9, 2009)
The visual inputs we receive can be collectively called visual data. Precisely how one defines visual data is a key question to ask. That is one of the questions we asked each author who wrote a chapter for this book. If one comes to a decision with respect to what visual data are, then the next question becomes, "What are visual data like?" Then, "What do they mean?" As with any data, we can collect it and compile it, but if we don't have some way to bring meaning it, it has little value to us. The answers may not be as straightforward as one might assume at the outset. The extent to which visual data permeates what we do as educators is such that it may be difficult to identify every discipline in which it emerges. In this book, we have tried to provide a forum for authors from a cross section of common disciplines: visual arts, English, literacy, mathematics, science, social science, and even higher education administration.
 Learning and Leading With Habits of Mind:
16 Essential Characteristics for Success
by Arthur L. Costa and Bena Kallick
Association for Supervision & Curriculum Development, 2008
The most powerful learning communities use these Habits of Mind to guide all their work. Yet sometimes the practicality of school life requires that people make individual commitments with the hope that their beliefs and behaviors will affect the whole. Teaching with the Habits of Mind requires a shift toward a broader conception of educational outcomes and how they are cultivated, assessed, and communicated. Learning and Leading with Habits of Mind aims to help you work toward and achieve a move from "individual" to "systems" in your thinking.
Read Chapter 9: Thinking Maps: Visual Tools for Activating Habits of Mind by David Hyerle